Best stock market trading tips, tricks with my secret indicators in india 2023 2024
Best Stock/Share Market Trading Tips, Tricks with My 3 Secret Indicators in India 2023 2024
Are you looking for the best methods and tricks to get profits on on stock/share market trading investment then you have reached the right place. Based on my stock trading trading experience i use basically 3 basic indicators which has given me good profits. Eventhough the accurate Buy or Sell signal can't be predicted, But these following indicators can help you to analyze the stock downward trends, upward trends, trend reversal and choose optimum stage for Buy and Sell signal of a stock. According to my user experience Paytm money app can help you invest, monitor and trade at anywhere, also having the all different types of indicators. Well, here are the 3 main indicators that i use for stock market trading
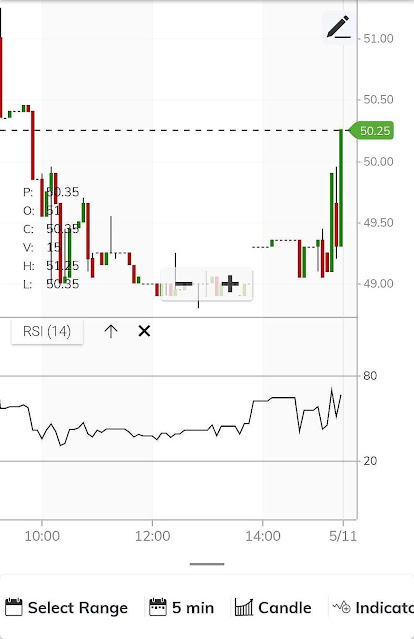
Stock Market Trading Tip 1 with RSI Indicator
RSI (Relative Strength Index) Indicator can be analyzed and used for knowing the stock trends ie, whether the stock value is going upwards or downwards. This technical indicator can also be used to identify the optimum stage for buy and sell signal of a stock. The stock price value always tries to stay within the overbought region(at 80) and oversold region(at 20). When the stock value is closer or crosses the oversold region(at 20) that is the perfect stage for buying a stock. Meanwhile when the stock value is closer or crosses the overbought region(at 80) that is the perfect stage for selling the stock. This method can also be used for intraday trading or delivery trading for profits.
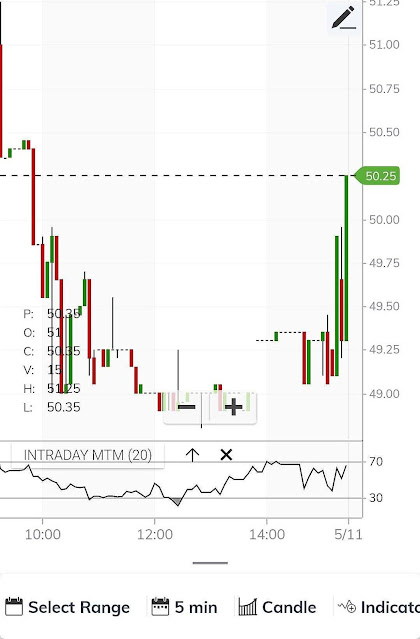
Stock Market Trading Tip 2 with Intraday Momentum Index Indicator
Intraday Momentum Index is one of the best indicators that can be used for daily trading process as well as delivery trading. This is just like RSI Indicator showing with much more precise stages where the stock can trend reversal. The stock price value always tries to stay within the overbought region(at 70) and oversold region(at 30). When the stock value is closer or crosses the oversold region(at 30) that is the perfect stage for buying a stock. Meanwhile when the stock value is closer or crosses the overbought region(at 70) that is the perfect stage for selling the stock. This indicator is very useful for intraday trading for daily profit earnings
Stock Market Trading Tip 3 with MACD Indicator
MACD indicator is one of the best indicator to identify the trend reversal of a stock. This indicator has a signal line in red and macd line in black. When the signal line cross over the macd line trend reversal occurs. When the signal line is above the macd line it will be decreasing trend in the stock value and when the signal line is below the macd line it will be increasing trend in the stock value.
Well these simple 3 indicators are very much useful for adequate profit earnings. There are other indicators also for confirming the trends, but basically for me these indicators are enough for good profitable trades. Always Buy at Dips and Sell at Tops for successful profits. Wishing you Best Happy trading!!!
If you are interested Grow your business with Techpep technologies that are one of the best best web design company in kerala, india and leading best IT Company in Kerala, India that provides Low cost ecommerce website design in india for all types of ecommerce business across the world. Choose Best SEO marketing company in india, Techpep technologies as they are one of the best website development company in kerala, india having best website designer in ernakulam and best website developer in kochi who provides all kinds of ecommerce website development in kerala, india, online shopping website development in kerala, india, best website redesign in kerala, digital marketing service in kerala, Web hosting services in kerala, Best logo design company in angamaly, seo company in angamaly, ecommerce website design development ernakulam, Business branding company in Kerala, Mobile application development in kerala.


